J. David Hughes is a geoscientist with four decades of experience analyzing Canada’s energy resources, including 32 years with the Geological Survey of Canada. He developed the National Coal Inventory and recently coordinated an assessment of Canada’s unconventional natural gas potential.
His 2013 publication, Drill, Baby, Drill: Can unconventional fuels usher in a new era of energy abundance?, was written for the Post Carbon Institute and a US audience.
Hughes notes that discussions about energy are often marred by vested interests, rhetoric and overblown expectations. In Drill, Baby, Drill, a historical examination of government oil and gas forecasts shows that production is invariably overestimated; Hughes then turns his attention to the recent enthusiasm for fracking.
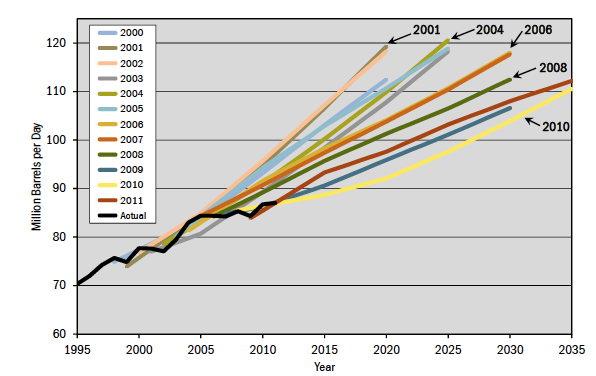
Figure 1. Energy Information Administration (EIA) predictions of world oil production going back to 2000. The 2002 projection overestimated 2011 production by 13 per cent. Hughes notes that forecasts by governments tend to be optimistic due to a need to show long-term growth in GDP. So are forecasts by energy companies and oil-producing organizations. More pessimistic projections are likely to come from independent analysts with no vested interests.
Hughes critiques the common practice of estimating the recoverable amounts of unconventional in situ resources and simply dividing these estimates by current consumption rates to produce x number of decades or centuries of reserves. He says that “two other metrics are critically important in determining the viability of an energy resource.”
The first metric is the rate at which the resource can be produced, regardless of its extent. The constraints are geological, geographical and geochemical, and Hughes states that despite the immense potential of in situ reserves and massive amounts of capital that have been invested, shale gas and tight oil fields have generally yielded very low rates as shown below.
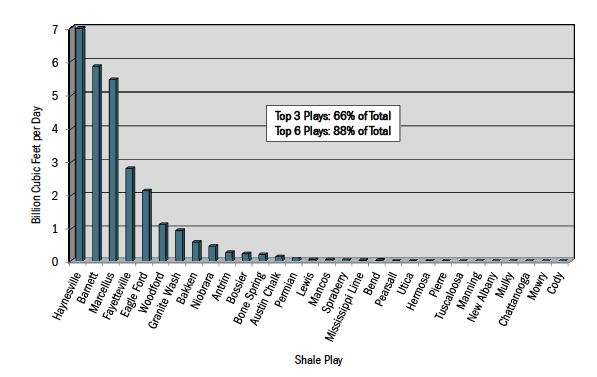
Figure 2. The production rate of 30 US shale gas plays, May 2012. The vast majority of production is concentrated in just a few plays. There is further variation in productivity within the best plays. High decline rates mean ever-increasing capital inputs for drilling and infrastructure to maintain production.
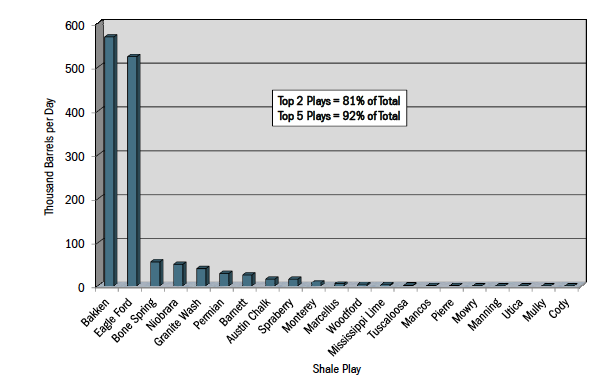
Figure 3. The production of 21 US tight oil plays, May 2012. The vast majority of production is concentrated in two plays. As with shale gas plays, high decline rates of shale oil wells mean ever-increasing capital inputs for drilling and infrastructure to maintain production.
Another metric to consider is the net energy yield of the resource: the difference between the required input and the energy embodied in the final product. The ‘energy return on energy invested’ (EROEI) is much lower on unconventional resources as the difficulty extracting them increases. The following graphic illustrates the relationship between increased energy inputs and unconventional oil and gas reserves.
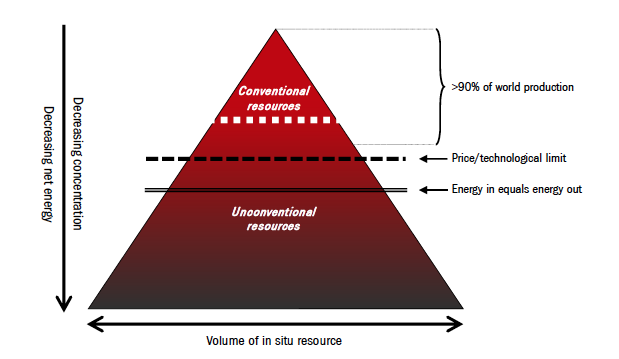
Figure 4. The dashed line represents a transition point where energy inputs start to increase in relation to the energy embodied in the produced hydrocarbons. The solid line is the point at which it costs as much, or more, in invested energy to recover the resource as the final product contains.
In addition to increased energy, fracking uses large volumes of water mixed with an undisclosed menu of hundreds of possible chemicals, some of them known carcinogens and neurotoxins. The collateral environmental damage is also usually greater for higher-input energy extraction.
Shale gas and tight oil fields have a very high rate of decline in productivity. The best shale gas plays are quite rare, and the sweet spots within them are the first to be exploited. The high decline rates require continuous capital inputs, estimated at more than US$42-billion per year. For comparison, the value of the shale gas produced in 2012 was only US$32.5-billion. Individual well-decline rates range from 79 to 95 per cent after 36 months. Currently, US shale gas production is declining for 36 per cent of wells and flat for 34 per cent.
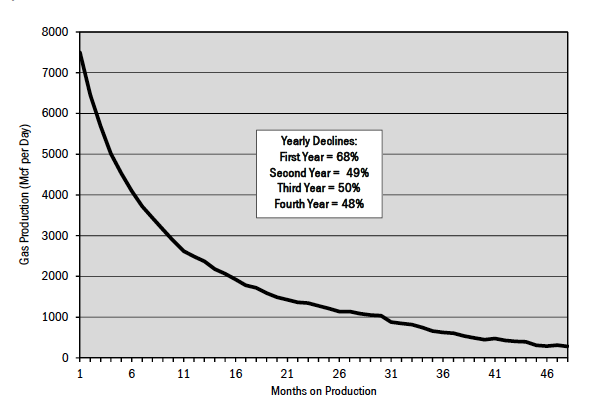
Figure 5. Typical decline rate for Haynesville shale gas wells.
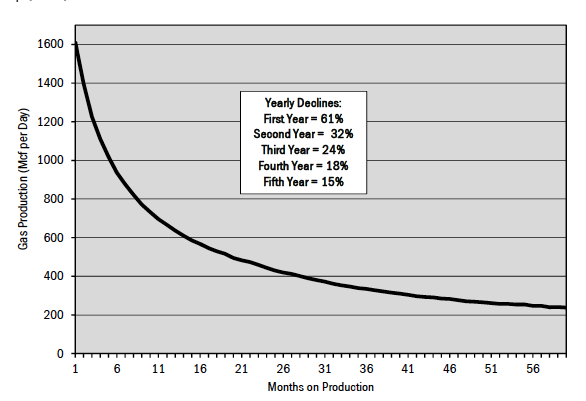
Figure 6. Typical decline rate for Barnett shale gas wells.
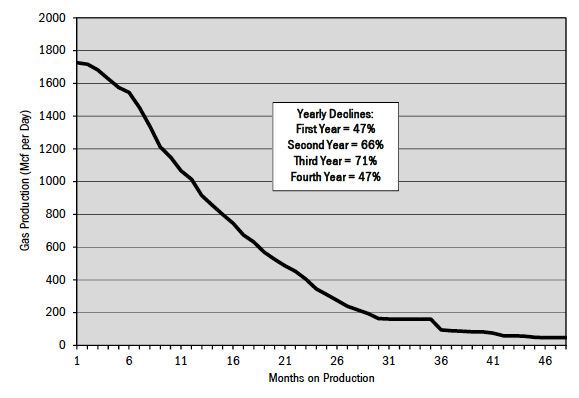
Figure 7. Typical decline rate for Marcellus shale gas wells.
Two tight oil plays in the US – the Bakken/Three Forks play in North Dakota and Montana and the Eagle Ford play in Texas – provide more than 80 per cent of the country’s production, indicating the rarity of good fields. Well-decline rates are between 81 and 90 per cent in the first 24 months. The annual costs to maintain production nationally are estimated at $35 billion. Oil production is projected to peak in 2017 and then collapse – providing a resource bubble lasting about ten years.
These two plays are the source of much of the hyperbole on ‘energy independence’ in that country. But Bakken wells especially show steep production declines. Looking at the last 66 months of data, the average first-year decline is 69 per cent and production drops by 94 per cent within five years. In six years the average Bakken well is little better than marginal – a ‘stripper’ well.
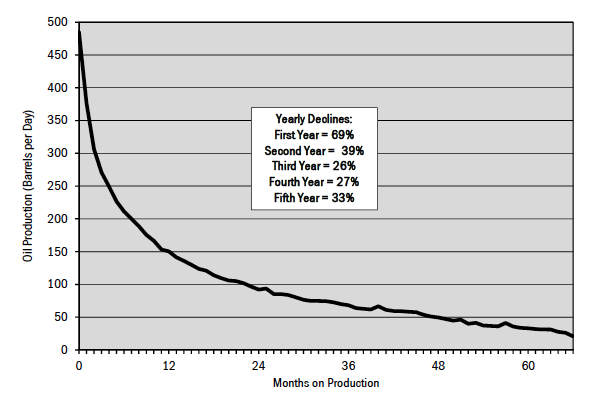
Figure 8. Typical decline rate for Bakken tight oil wells.
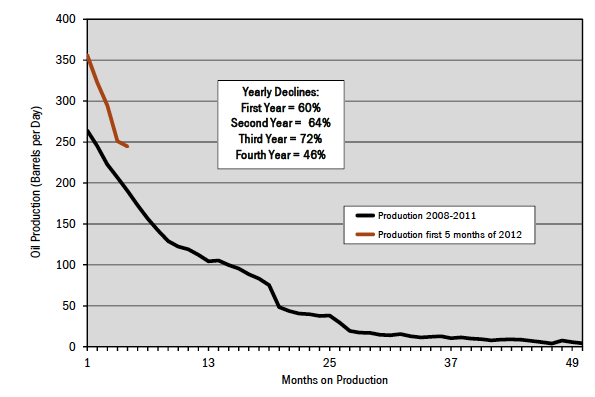
Figure 9. Typical decline rate for Eagle Ford tight oil wells.
Hughes’ research is stunning. The recent rhetoric on US energy self-sufficiency is based on extremely aggressive forecasting of production from unproved resources. Exploiting shale gas and tight oil would require a fracking frenzy that would make current environmental concerns “pale by comparison.” Politicians and other pundits don’t differentiate between hydrocarbons of varying quality and don’t communicate the difficulty and energy required to produce them. Exaggerated claims are based on optimistic assessments of resource volumes and little else.
Janet Kimantas is associate editor at A\J with degrees in studio art and environmental studies. She is currently pursuing an MES at UWaterloo. She splits her spare time between walking in the forest and painting Renaissance-inspired portraits of birds.


